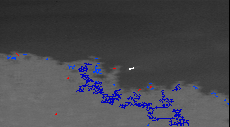
Frame 8 P=1705 -> S=385 -> M=49 -> F=1
Start Motion samples
2119 184.667 47.6667 2.84217e-14 0.5 3 120.333 120.333 4.35322
2080 218.333 46 -9.66667 -6.33333 3 90.3571 90.3571 4.93057
2091 56.6667 48.6667 -9.41667 -1.16667 3 235.833 235.833 4.35322
.
.
.
3358 350.071 249.357 7.67857 0.0491071 14 32.4562 32.4562 6.95841
3380 152.714 252 -7.34586 -1.10526 7 235.679 235.679 4.40858
1746 273 252.667 -4.66667 -6 3 78.5 78.5 5.09916
Start Final samples
124 179.636 243.182 -13.0594 7.93357 11 221.42 221.42 5.57675
The first line contains the number of peaks detected during preprocessing (P), the number of regions surviving static filtering (S), present after motion tracking (M) and finally after temporal filtering (F). Then follows feature vectors for all the regions present after motion tracking (which come after a line "Start Motion samples") and temporal filtering (which come after a line "Start Final samples"). The number of samples in each case is specified by M and F respectively.
The format of the feature vector is: region label, centroid (row,col), motion vector (rows,cols), region size, average contrast, gradient contrast and compactness.